DORA - 5 key metrics every Engineering Manager must track
As an Engineering Manager, DORA metrics are invaluable tools that address several key challenges and answer crucial questions related to the management and performance of software development teams.
The term "DORA" was named after the team at Google who identified these metrics - DevOps Research and Assessment team (DORA). Initially, there were only 4 metrics but in later revisions, another metric was added.
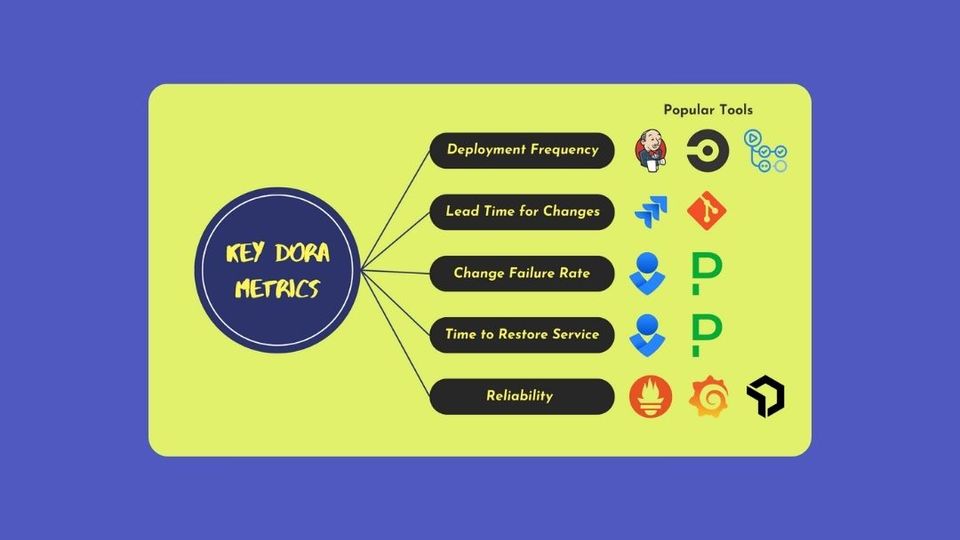
Let's get started by understanding these 5 metrics.
1. Deployment Frequency
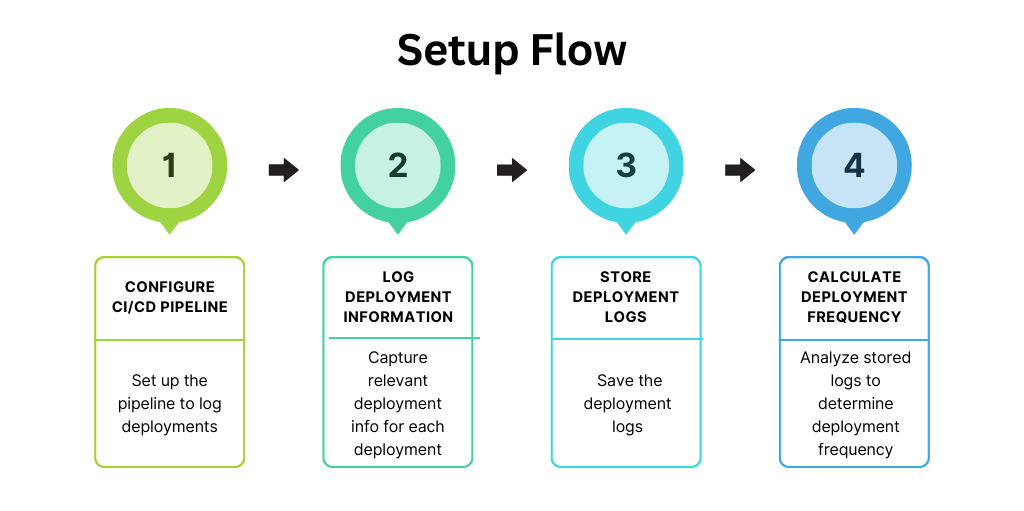
This metric measures how often an organization successfully releases to production. A higher frequency generally indicates a more agile and responsive development process. This can be daily, weekly, monthly, etc., depending on the organization's capabilities and needs.
To set this up, you'll need:
- Tools: Continuous Integration/Continuous Deployment (CI/CD) tools like Jenkins, CircleCI, or GitHub Actions.
- Setup: Configure your CI/CD pipeline to log each deployment. Use these logs to calculate the frequency.
2. Lead Time for Changes
This is the amount of time it takes for a commit to be deployed into production. This metric helps in understanding the speed of the development process from coding to deployment. Shorter lead times suggest a more efficient and streamlined process.
To set this up, you'll need:
- Tools: Issue tracking and version control systems like JIRA and Git.
- Setup: Track the time from when work starts on an issue until the associated code is deployed. This might require integrating your issue tracker with your version control and deployment systems.
3. Change Failure Rate
This measures the percentage of deployments that fail in production and require immediate remedy (like a hotfix, rollback, fix forward, etc.). A lower change failure rate indicates better quality of the deployment process and more reliable releases.
To set this up, you'll need:
- Tools: Deployment tools, incident tracking systems.
- Setup: Monitor and record the rate of failures in production deployments. This may involve tagging incidents in your incident tracking system as related to recent deployments.
4. Time to Restore Service
This measures the time it takes for a team to recover from a failure in production (e.g., a service outage or a broken feature). A shorter time to restore is typically indicative of a team's ability to quickly respond to and fix issues in production.
To set this up, you'll need:
- Tools: Incident management tools like PagerDuty or OpsGenie.
- Setup: Measure the time from the start of an incident to its resolution. Ensure incidents are logged accurately and resolved time is recorded.
5. Reliability
This metric measures the stability and dependability of a software system in production. It can be quantified in several ways, such as uptime, the number of critical incidents, the severity of incidents, mean time between failures, or other measures of how reliably a system performs its intended functions. Reliability as a metric reflects how well the system meets the expectations and needs of its users and stakeholders in terms of availability, service quality, and performance.
To set this up, you'll need:
- Tools: Monitoring and alerting systems like Prometheus, Grafana, or New Relic.
- Setup: Set up monitoring for key indicators of system health, such as uptime, error rates, and performance metrics. Define what reliability means for your service and track these metrics continuously.
Using DORA metrics
Here's a detailed perspective on how these metrics solve problems and the questions they help answer:
Problems solved by DORA metrics
- Identifying Process Inefficiencies: One of the most challenging aspects of engineering management is identifying where processes are inefficient or breaking down. DORA metrics like Lead Time for Changes and Deployment Frequency help pinpoint if there are bottlenecks in the development pipeline.
- Balancing Speed and Stability: Balancing the need for rapid development and deployment with the necessity of maintaining a stable, reliable production environment is crucial. Metrics like Deployment Frequency and Change Failure Rate directly inform whether we are achieving this balance.
- Improving Team Performance: Understanding how well the team is performing and where improvements are needed is critical. DORA metrics provide quantifiable data to assess team performance, identify areas for improvement, and track the impact of changes over time.
- Resource Allocation and Prioritization: Deciding where to allocate resources and what initiatives to prioritize can be challenging. Metrics like Time to Restore Service and Change Failure Rate can highlight areas needing more resources or process refinement.
- Ensuring High Product Quality: Ensuring that the software delivered is of high quality and meets user expectations is a key responsibility. The Change Failure Rate metric, in particular, provides insights into the quality of software being deployed.
- Maintaining Customer Satisfaction: High reliability and quick, efficient responses to problems are crucial for customer satisfaction. The Reliability metric, along with Time to Restore Service, helps ensure that customer-facing services are consistently available and reliable.
Questions answered by DORA metrics
How efficiently are we delivering new features?
Answered by: Deployment Frequency and Lead Time for Changes. These metrics indicate how quickly and frequently new features are being rolled out.
Where should we invest to improve?
Answered by all DORA metrics collectively. Analyzing these metrics can guide decisions on whether to invest in automation, tooling, training, or process changes.
Are our improvements making a difference?
Answered by tracking changes in these metrics over time. This allows us to measure the impact of improvements or changes in our practices.
Are we building the right way?
Answered by Change Failure Rate metric. A high rate suggests issues with the development practices, possibly requiring better testing or more robust design reviews.
How well are we responding to issues?
Answered by Time to Restore Service metric. This metric tells how quickly the team can respond to and resolve issues, which is crucial for maintaining a reliable service.
Is our system reliable?
Answered by Reliability metric. This new addition helps understand if the system is consistently meeting the performance and availability standards expected by users and the business.
How do we compare to industry standards?
Answered by benchmarking with industry data on DORA metrics. Understanding where we stand compared to industry peers can guide strategic decisions and goal-setting.
Conclusion
As an Engineering Manager, DORA metrics serve as a compass guiding the team towards efficient, reliable, and high-quality software delivery. They offer a data-driven approach to understanding and improving our processes, ensuring alignment with both business objectives and customer needs.
References


How about taking this discussion one step forward and share your anecdote or thoughts on this topic anonymously on Invide community forum


Member discussion