Get started with machine learning

This is a transcript of the talk given by Sandeep Giri at Git Commit Show 2019
About the speaker
Sandeep Giri has worked with Amazon, InMobi, and founded CloudxLab. He has taught Machine Learning to 1000+ engineers across the globe. Many of his students include professors and professionals around the world. With his 18+ yrs experience in the tech industry and being a full-time machine learning instructor, he is one of the best people to learn about Machine Learning from.
You can also follow him on LinkedIn and Twitter.
Transcript
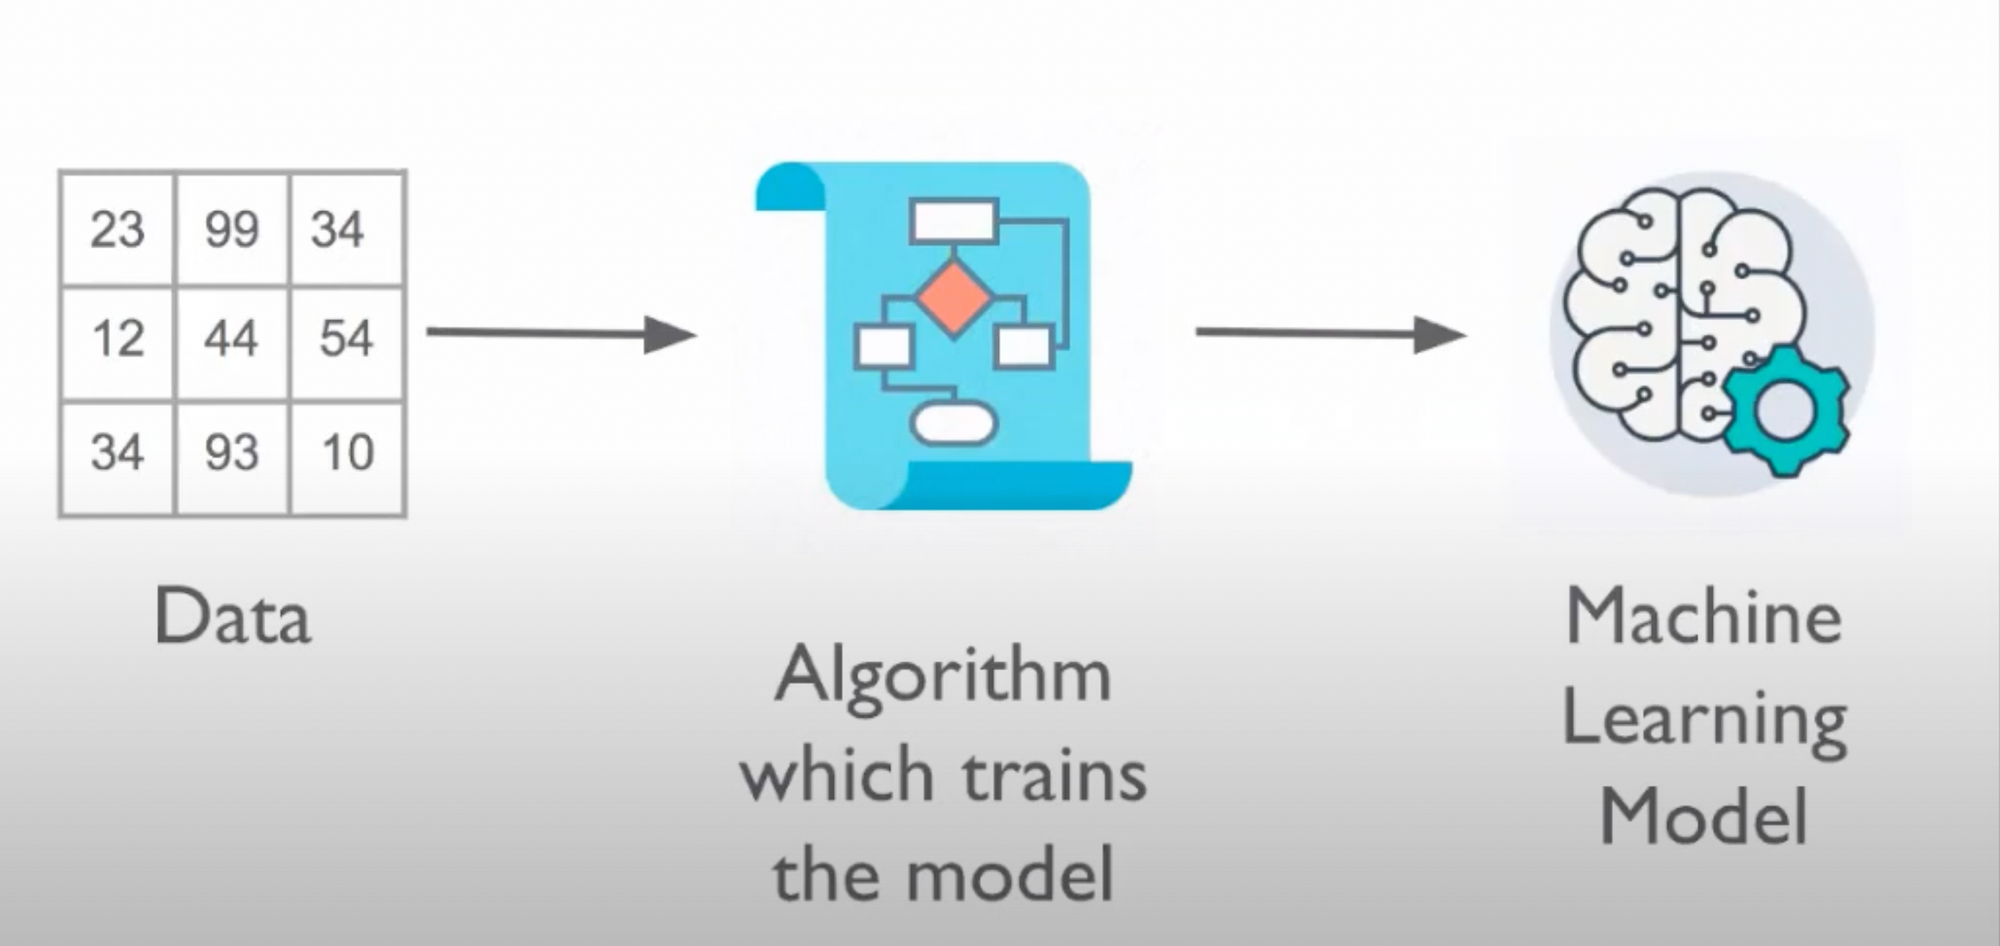
Machine Learning is a type of software that works based on examples. You give it some examples, it learns from that and when you give new inputs to it, it will try to generate results based on the previous learning.
This video on automating Mario game will give you a brief idea about ML
A real world example : The SPAM filter on Mail services
A great example of Machine Learning is the spam filter on various mailing services and how it filters out spam mails from the important ones.
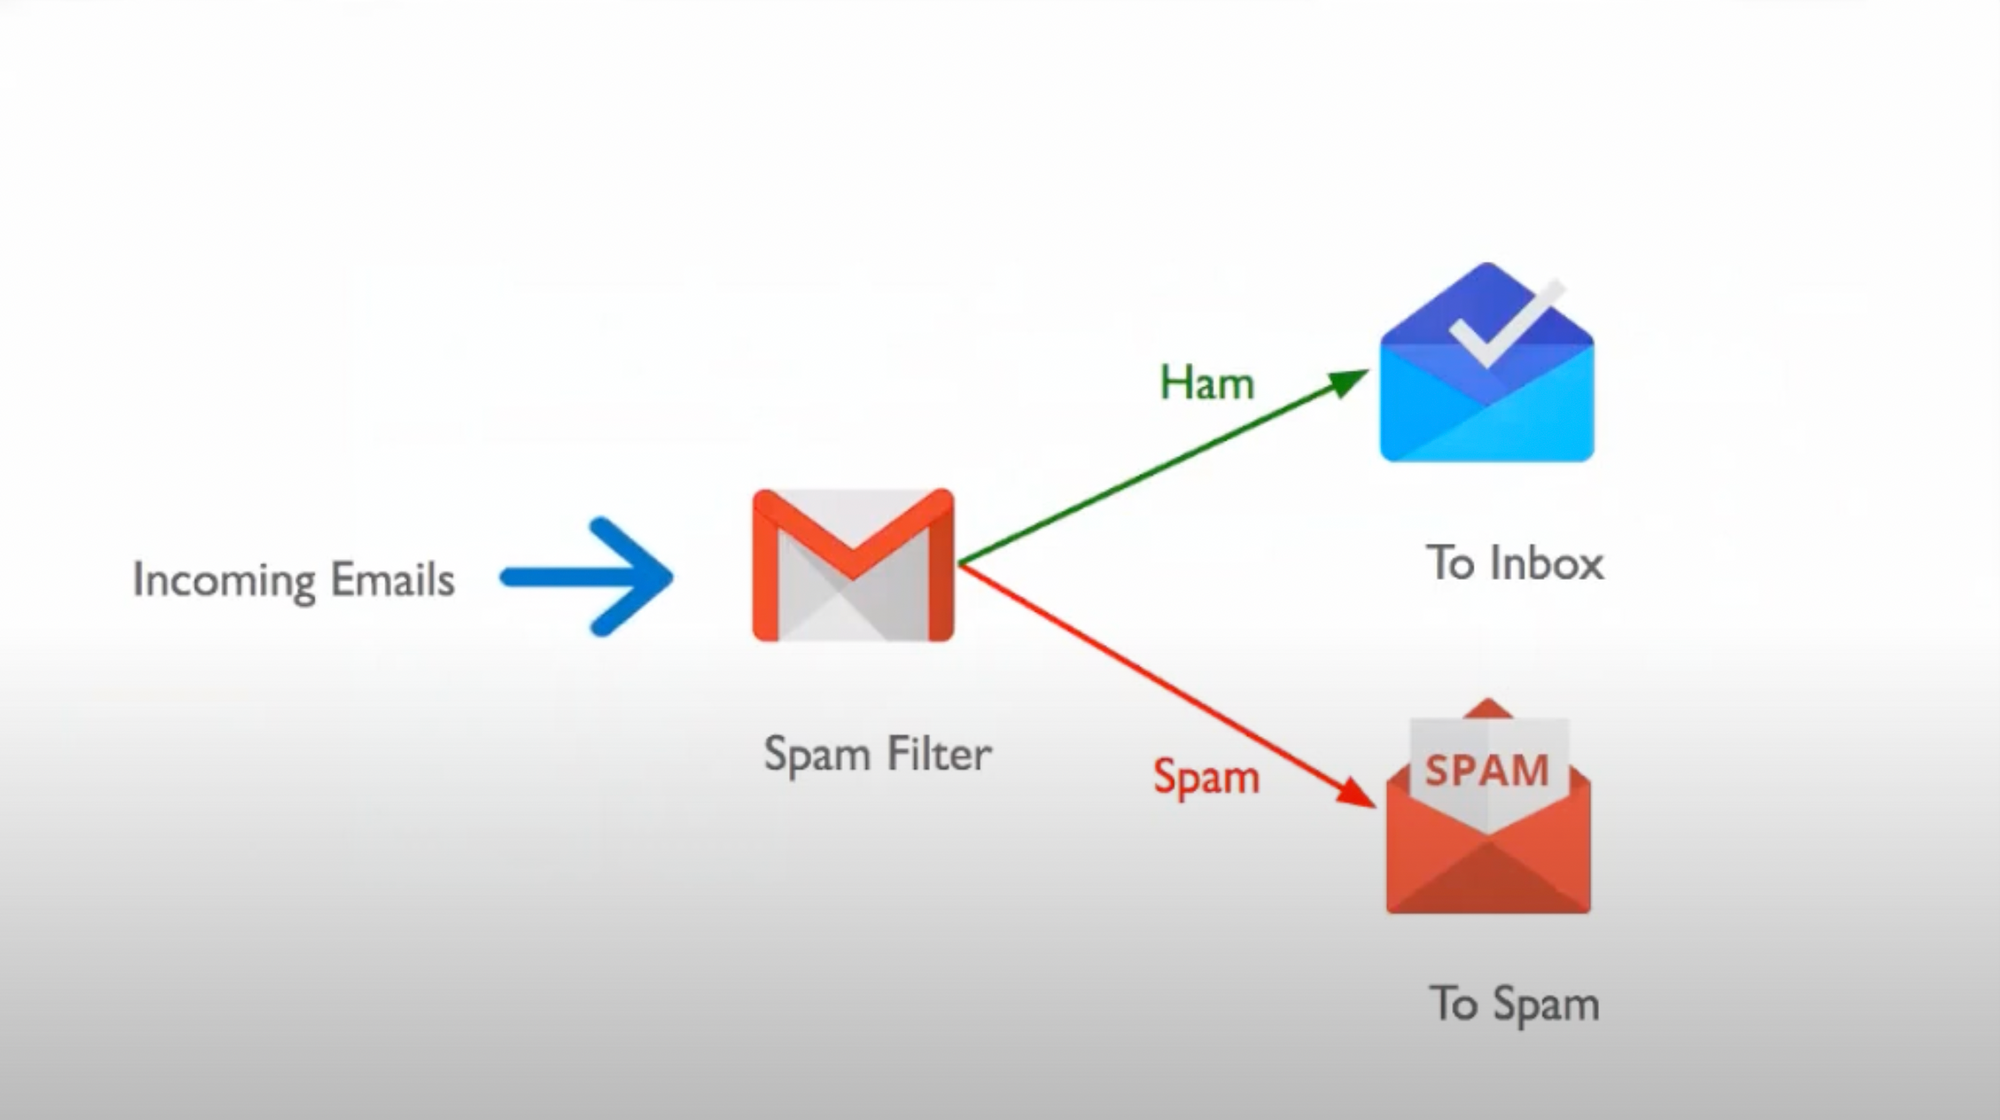
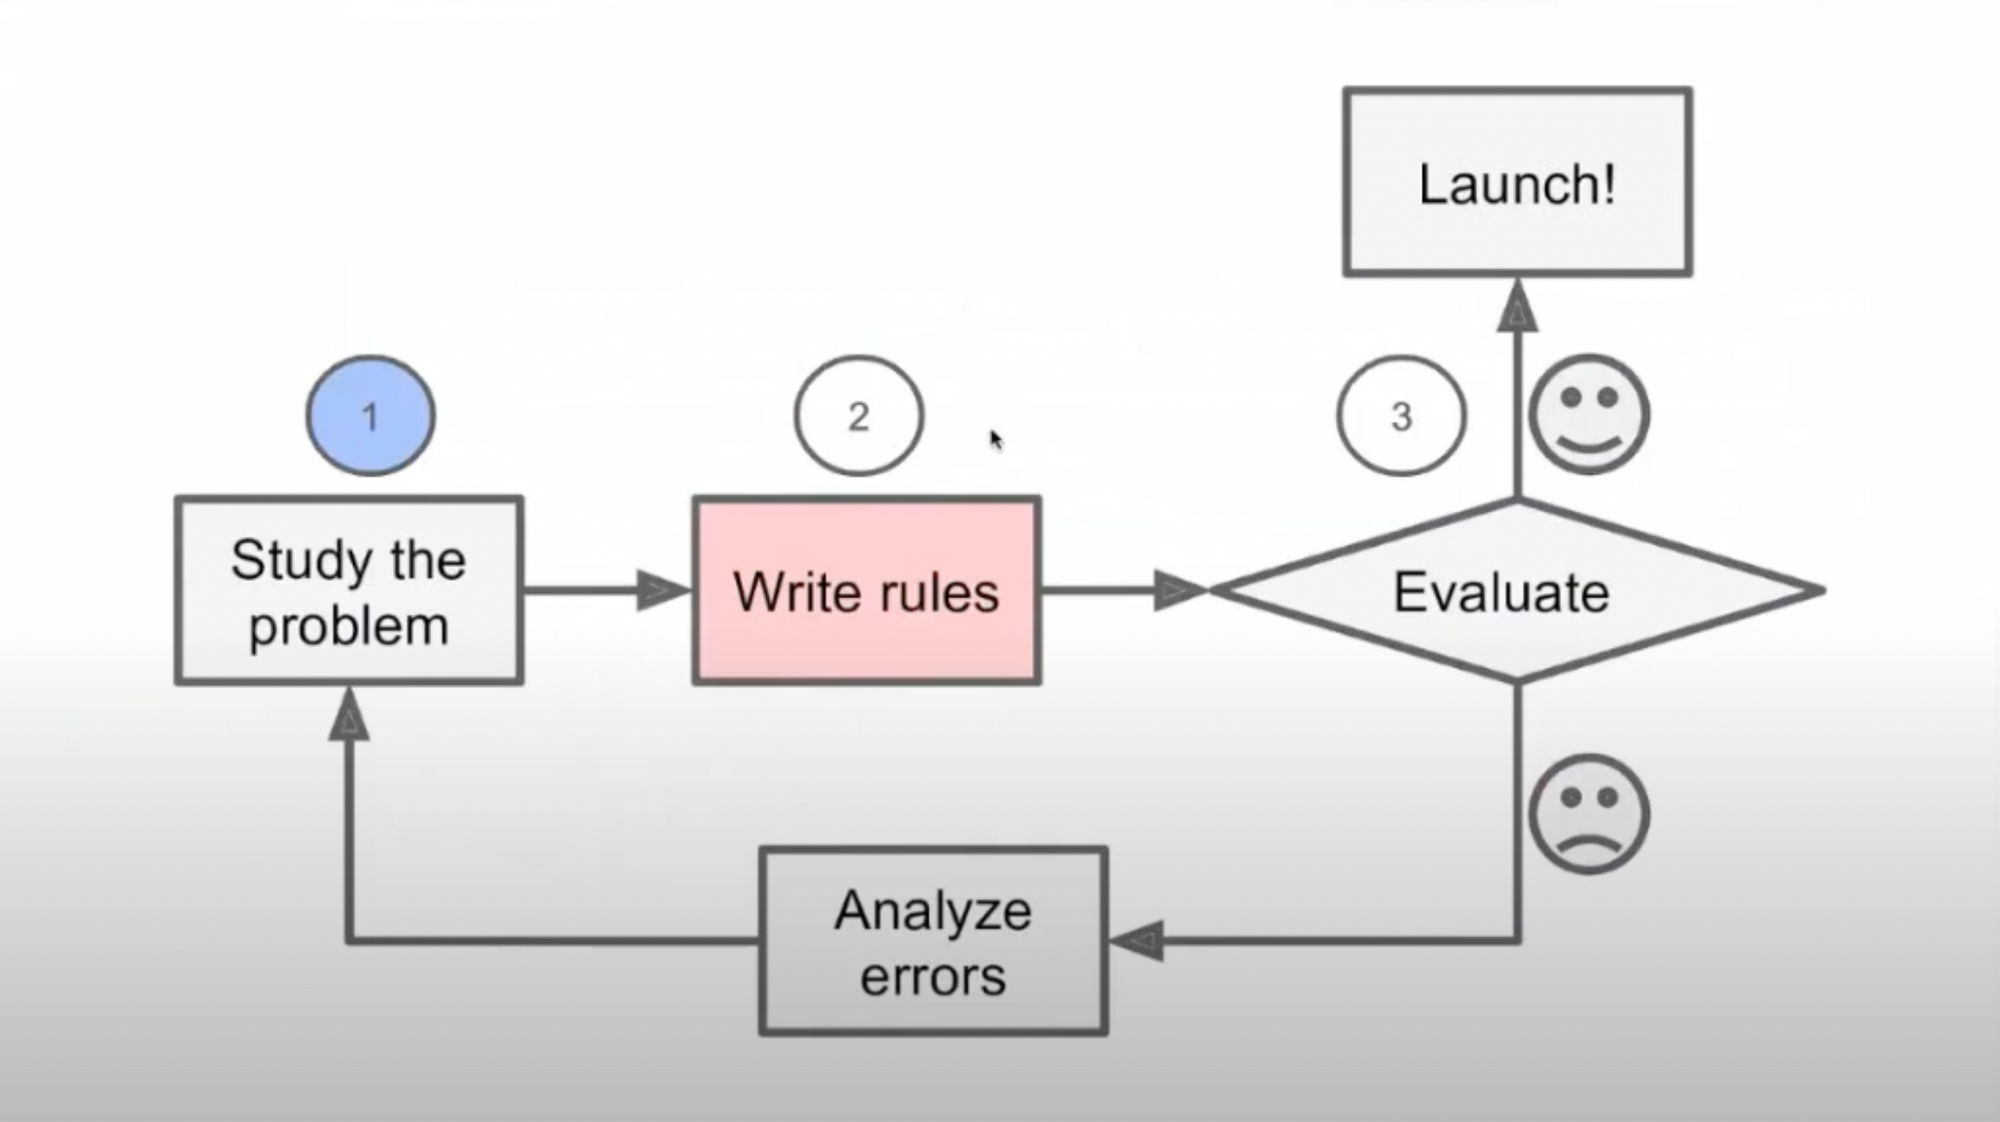
By following the traditional approach for making this spam filter, we keep on writing various rules and many if statements till we get the desired functioning. This approach works fine until the code becomes unmanagable, companies start changing the keywords and the filter fails.
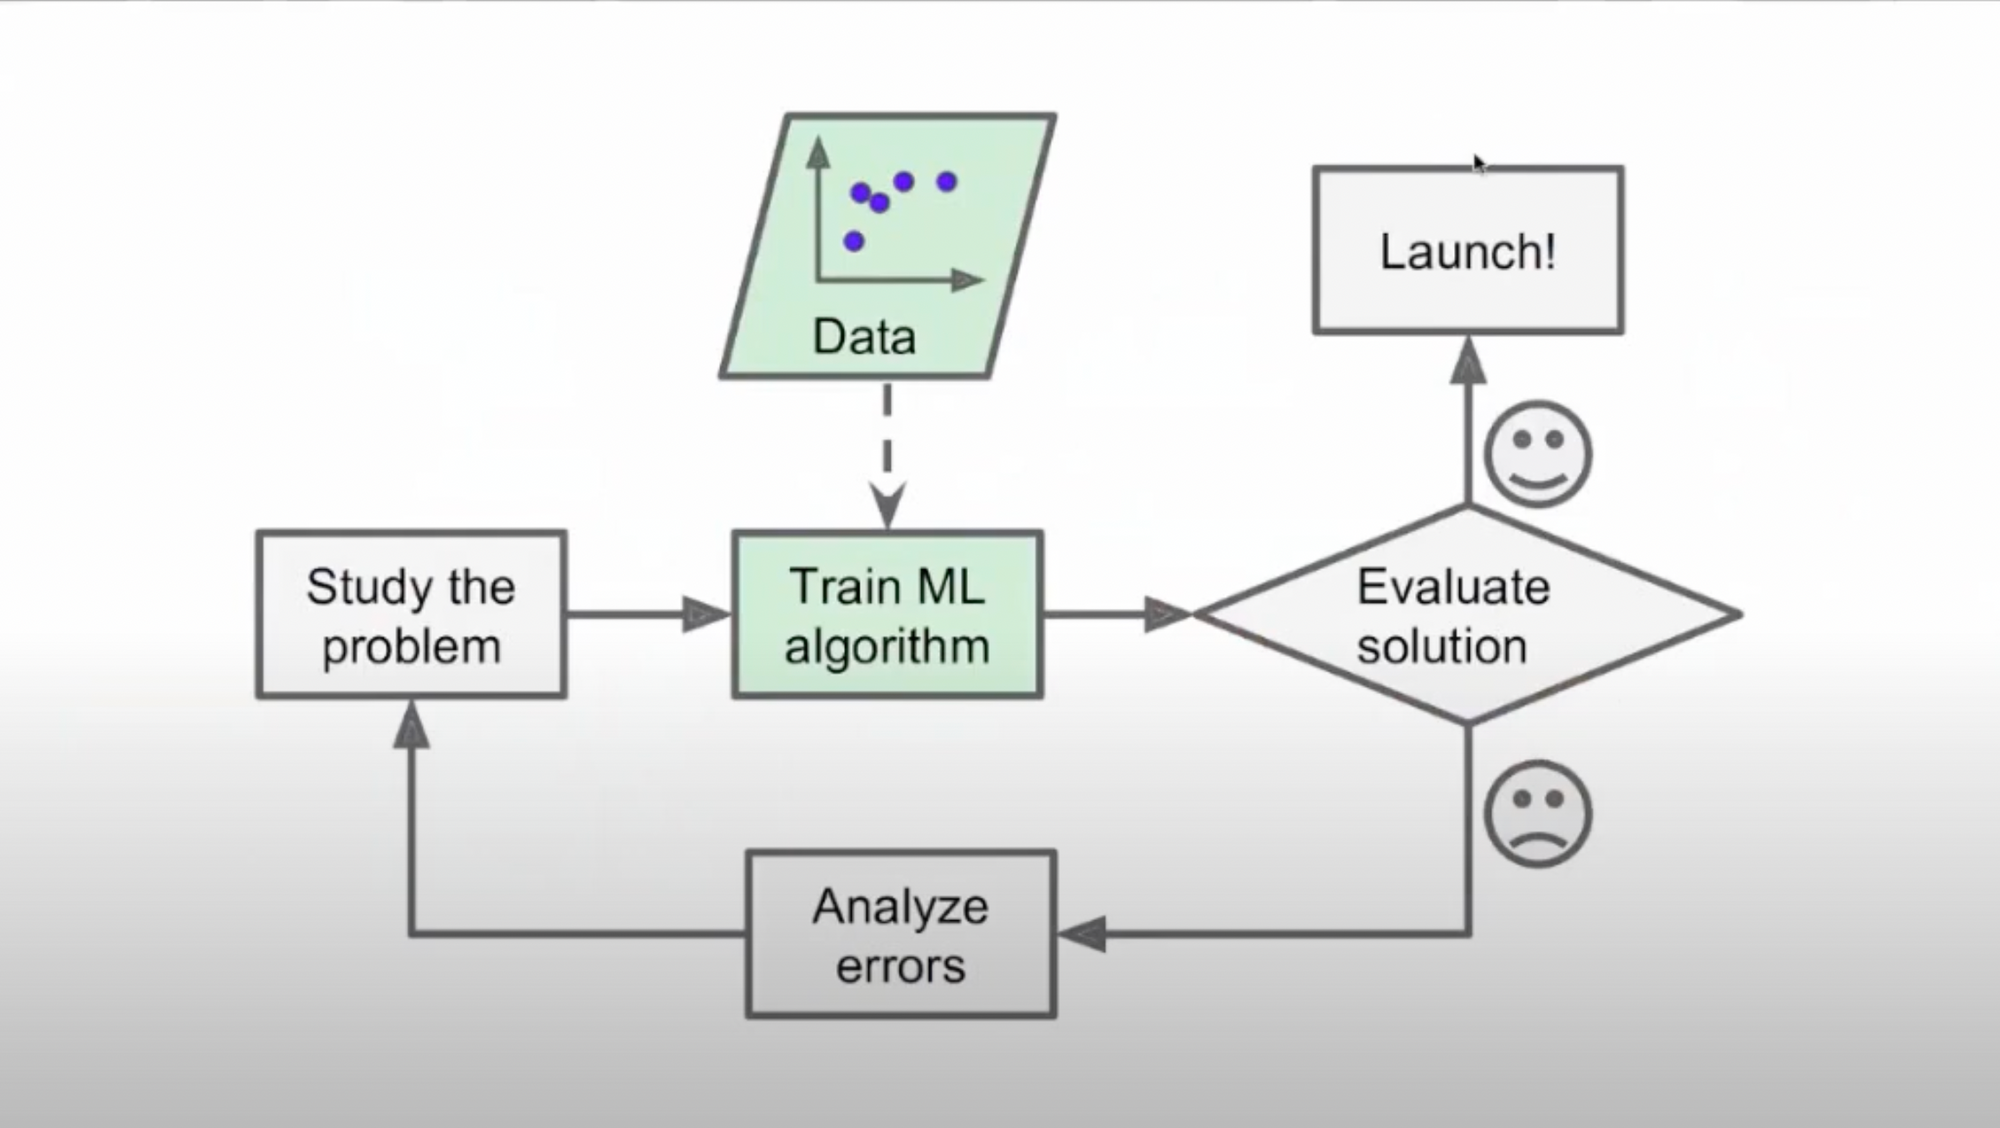
This problem is solved with the help of ML where a model can be trained to filter out spam mails with the help of various datasets. The machine learns from the data we provide and comes up with solutions on it's own.
To feed the data to the machine, we need to translate the data in terms of Features, Labels and Instances.
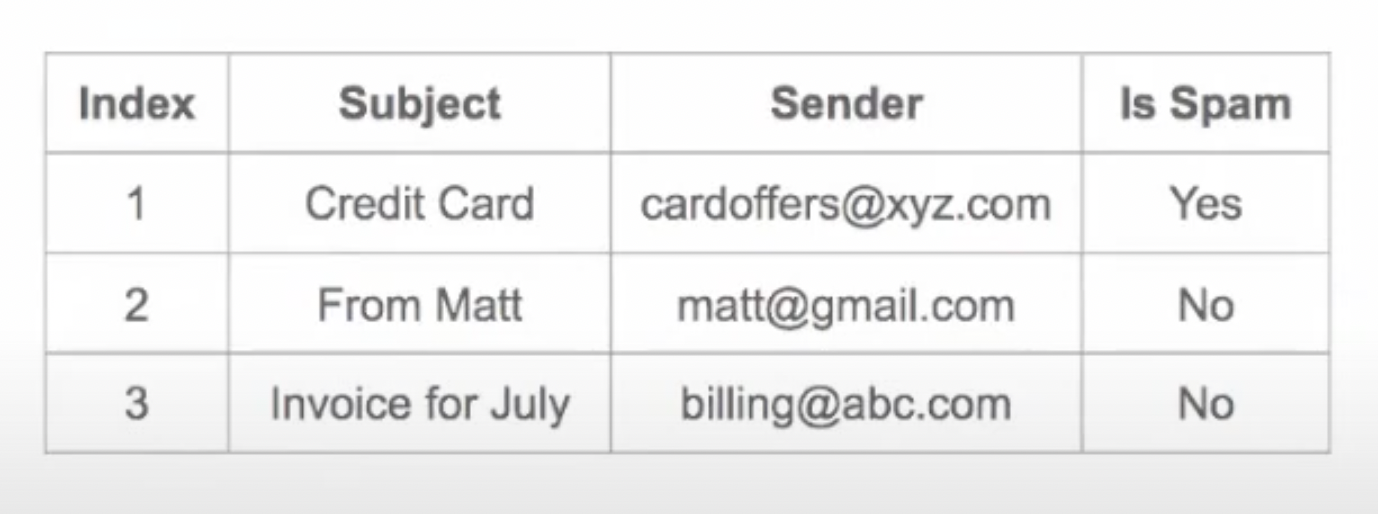
So we take the data, put it in form of a table, mark the lables, features, and then feed it to the machine.
Labels are the outcomes we are looking for and instance is each observation.
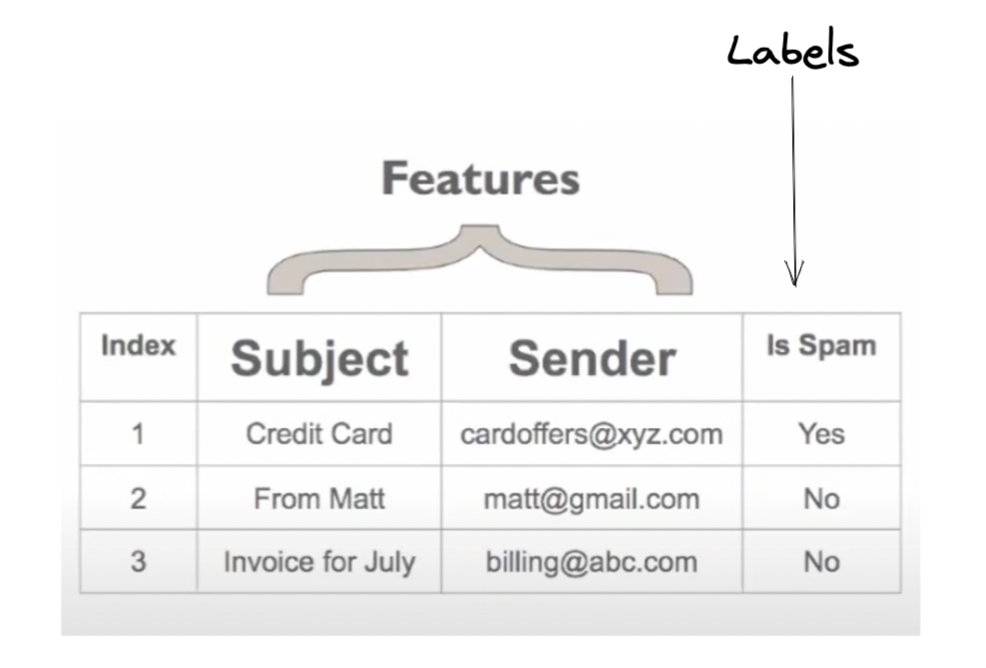
A single row of data is called Instance
Supervised and Unsupervised Machine Learning
Supervised machine learning is the type of machine learning where machine is trained with the help of specific training data.
Unsupervised learning is a type of algorithm that learns patterns from untagged data.
The machine learning process
- We get the data and figure out whether it is supervised or unsupervised
- We figure out the instances and attributes
- We break the dataset into 2 parts - Training Set(80%) and Test Set(20%)
Training set is the dataset which we use to train our model whereas Test set is the dataset which we use to test our trained model.
End to end project
We'll now start with a hands-on project to get a better idea. The project we'll be making is "Predicting the housing prices in California"
Checklist for Machine Learning Projects
- Look at the big picture
- Get the data
- Explore the data to get insights
- Prepare the data for Machine Learning algorithms
- Explore many different models and short-list the best ones
- Fine-tune the model
- Present the solution
- Launch, monitor and maintain the system
Creating the project
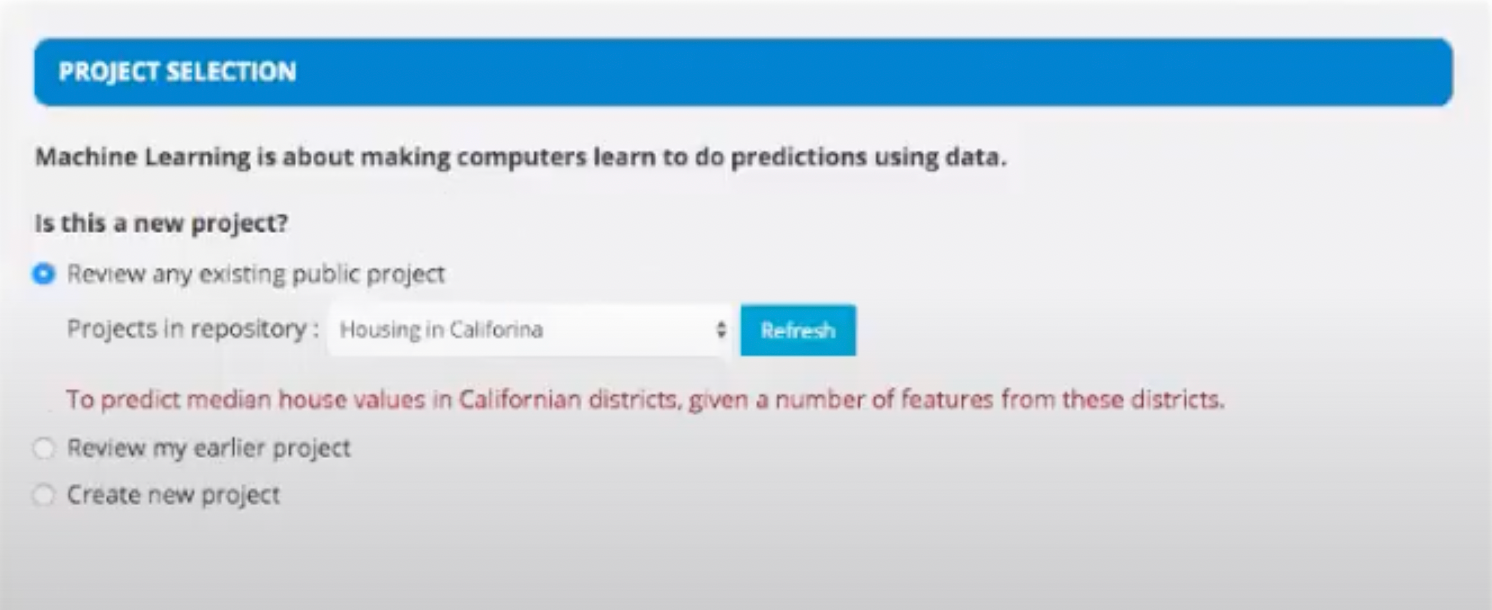
- Go to Cloudxlab and in the project selection panel, select the project. You can create a new project if needed.
- Then, select Supervised Learning as our project is a supervised learning project.
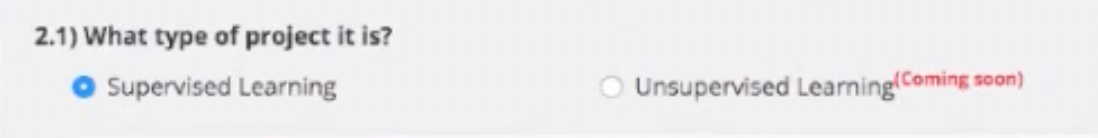
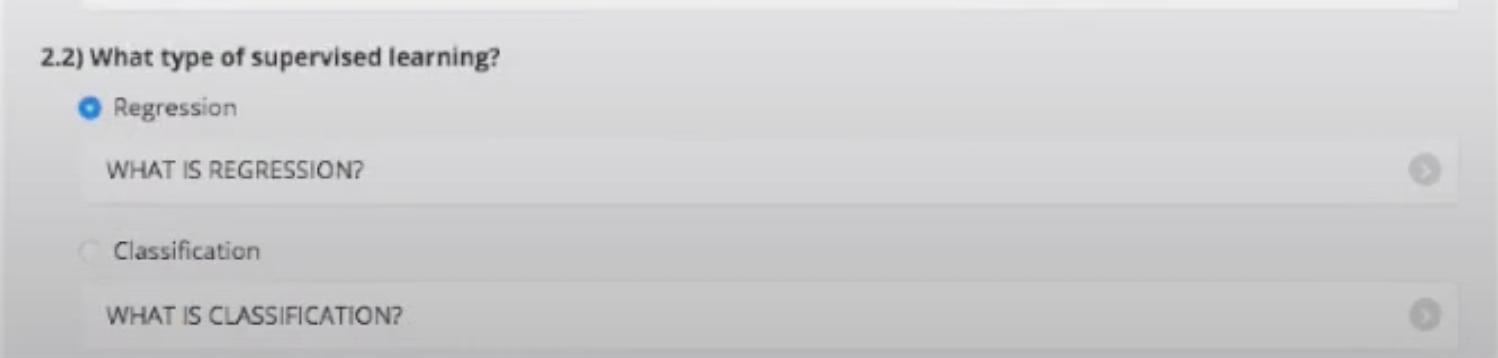
- Then, select regression under the type of supervised learning as the model predicts some continuous values.
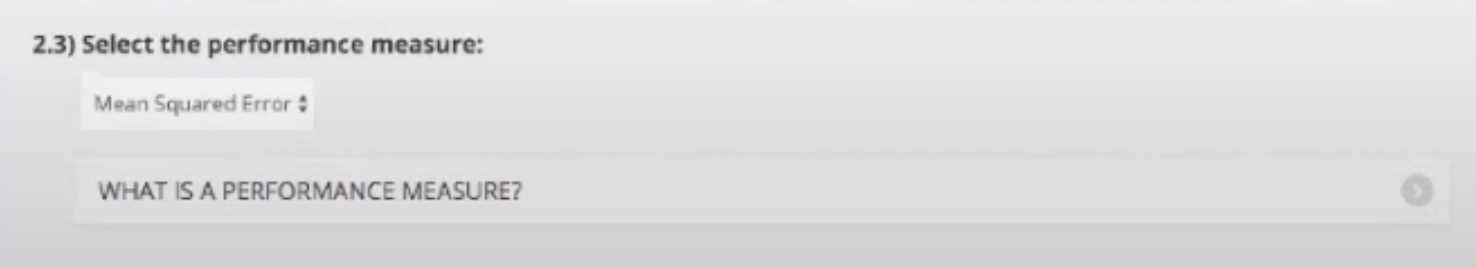
- Then, we select Mean Squared error in the drop down menu under performance measure. It is done as the performance prediction for regression is done using mean square error method.
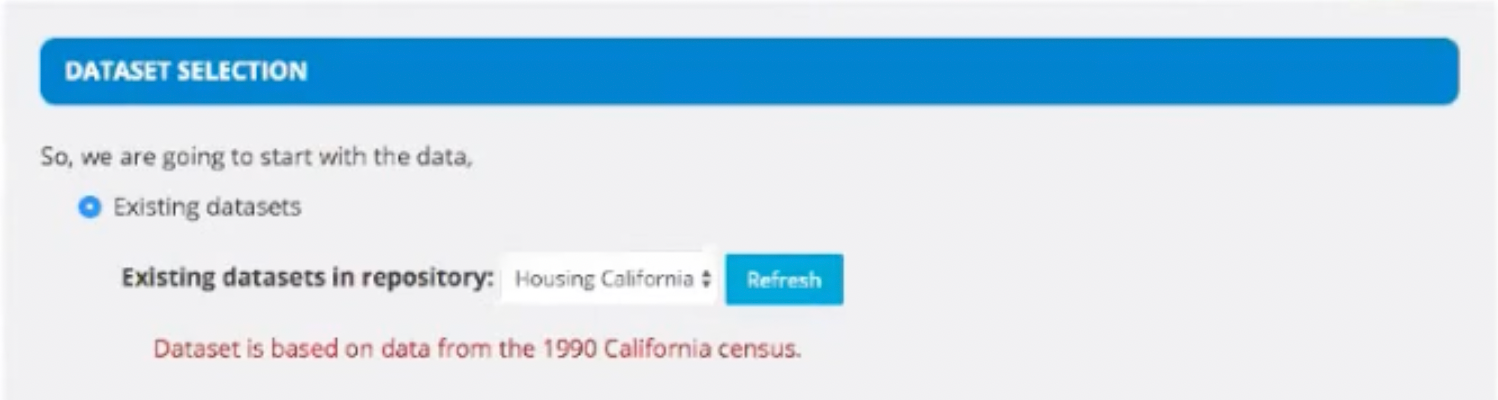
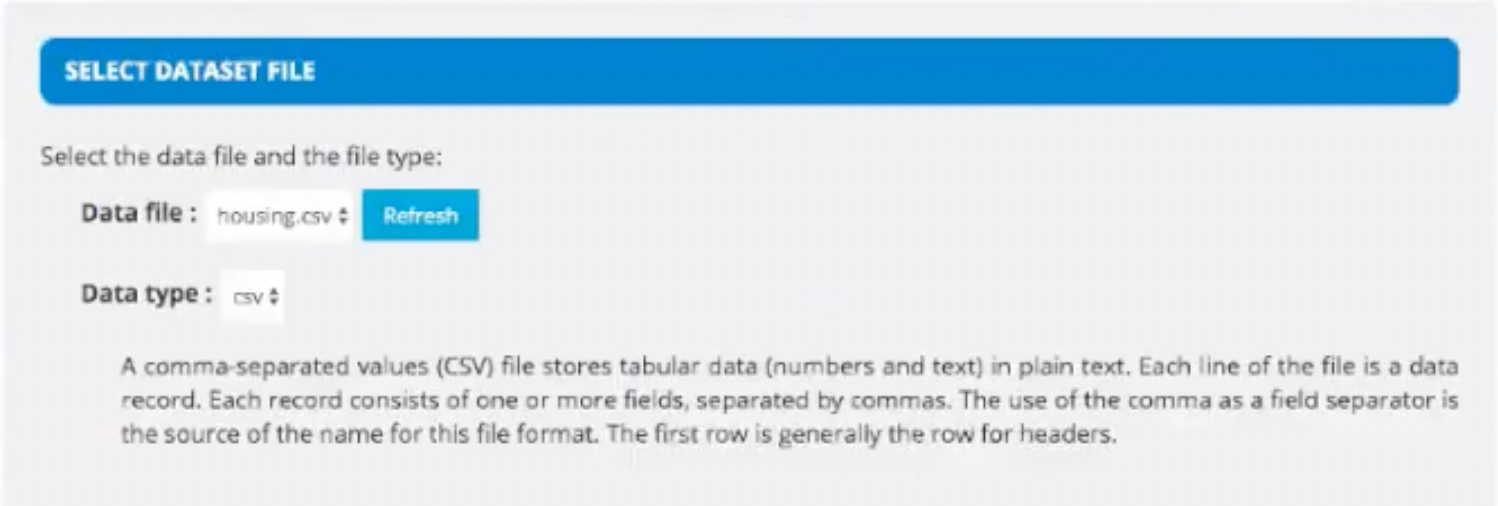
- Then, we select Existing Datasets under the dataset selection.
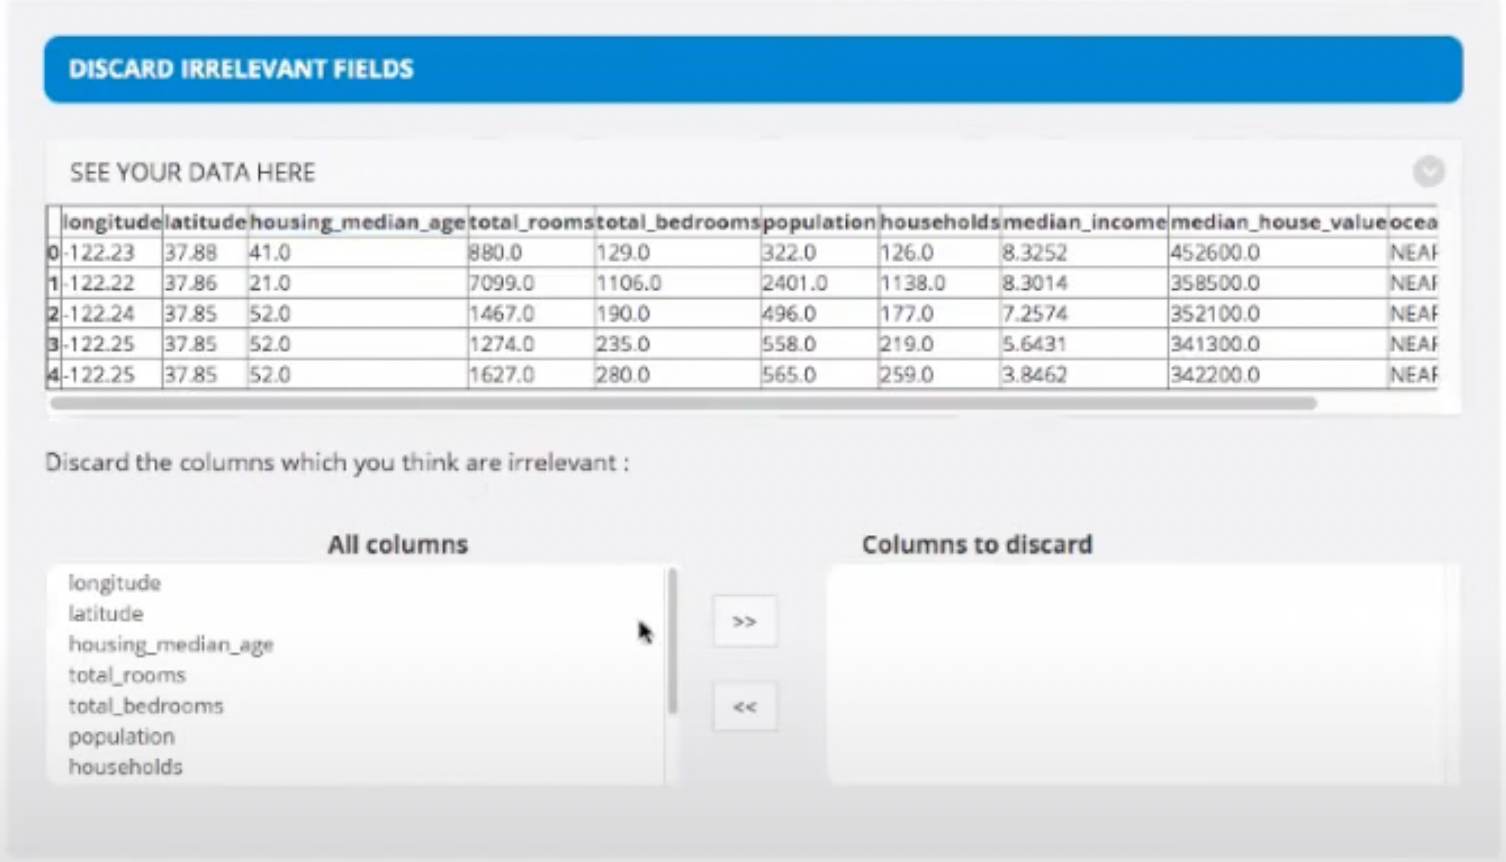
- Then, we'll upload our .csv file and discard the columns we don't need. For example, if there is some ID column, we don't actually need it for the predictions. It will just be a waste of memory for the algorithm.
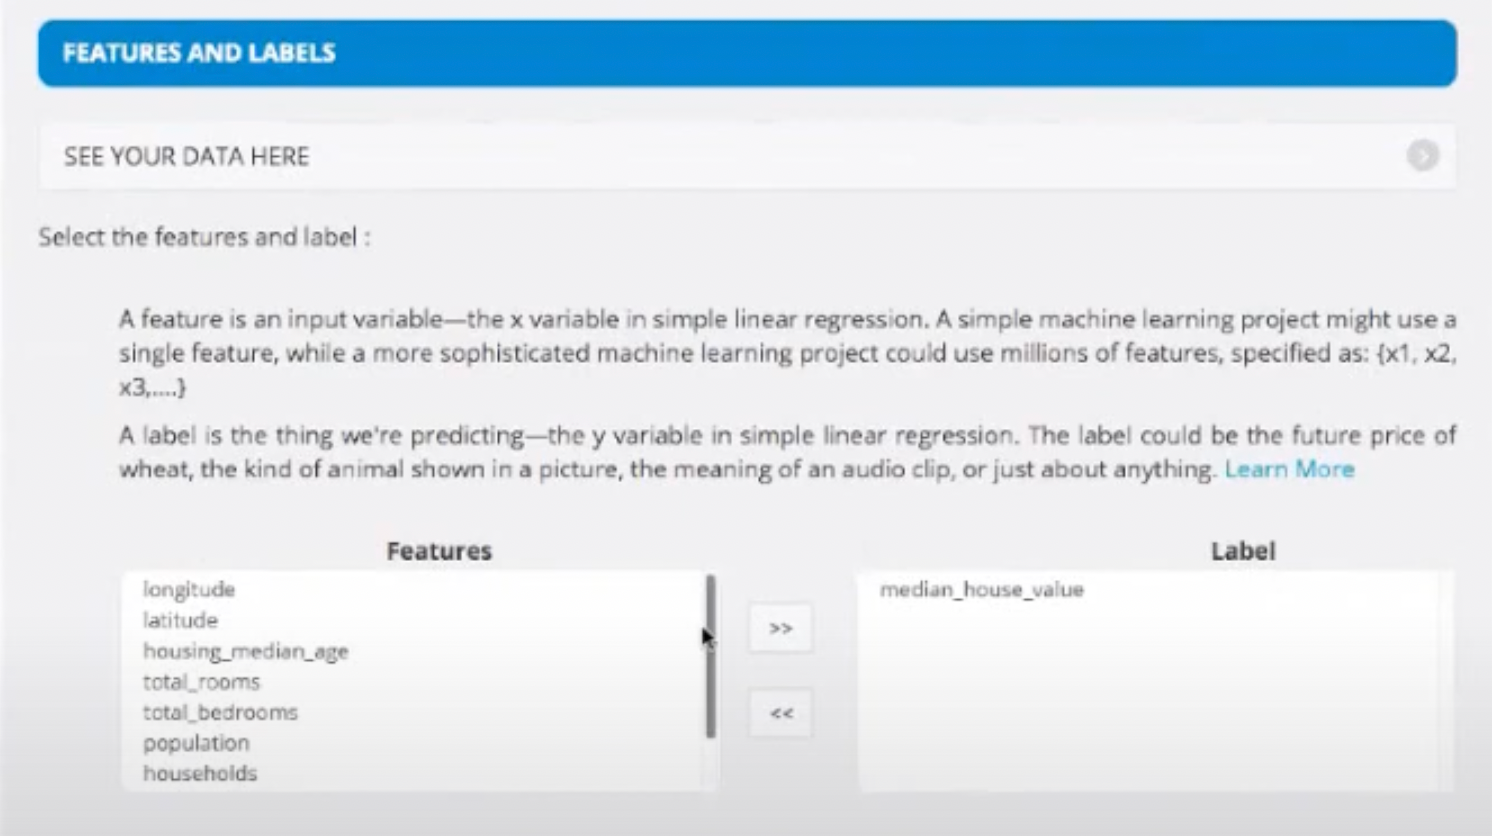
- Then, we segregate the Features and Labels. Labels are the outcomes we are looking for and feature is each observation.
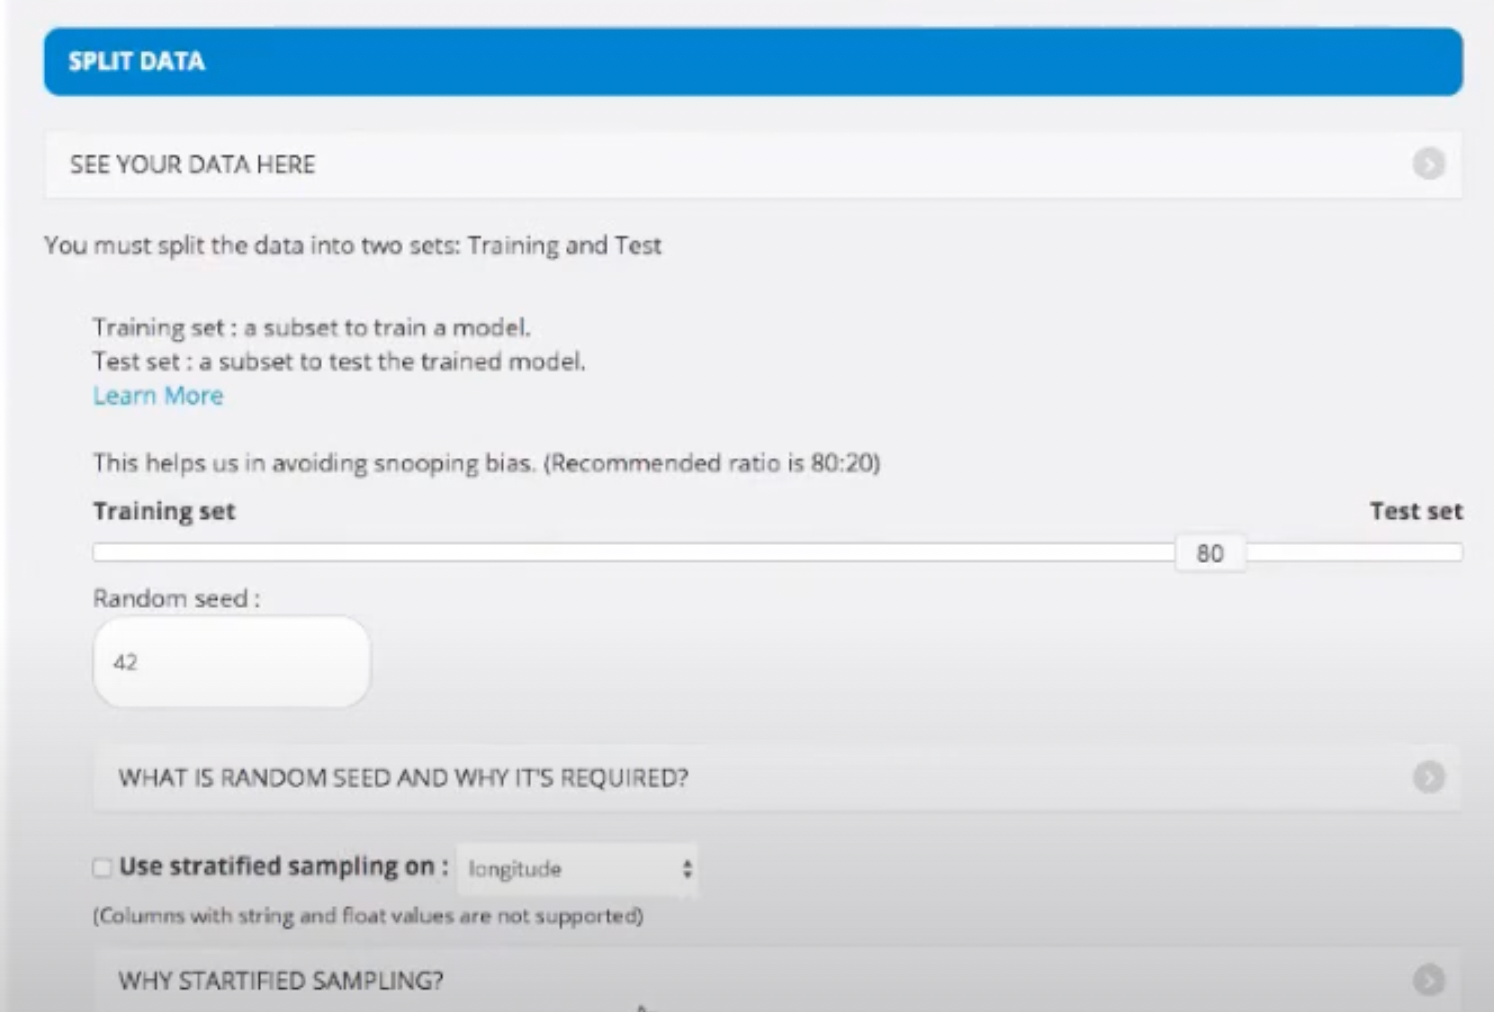
- Then, we split the data into training set and test set. We generally maintain a ratio of 80 (Training Set) and 20 (Testing Set)
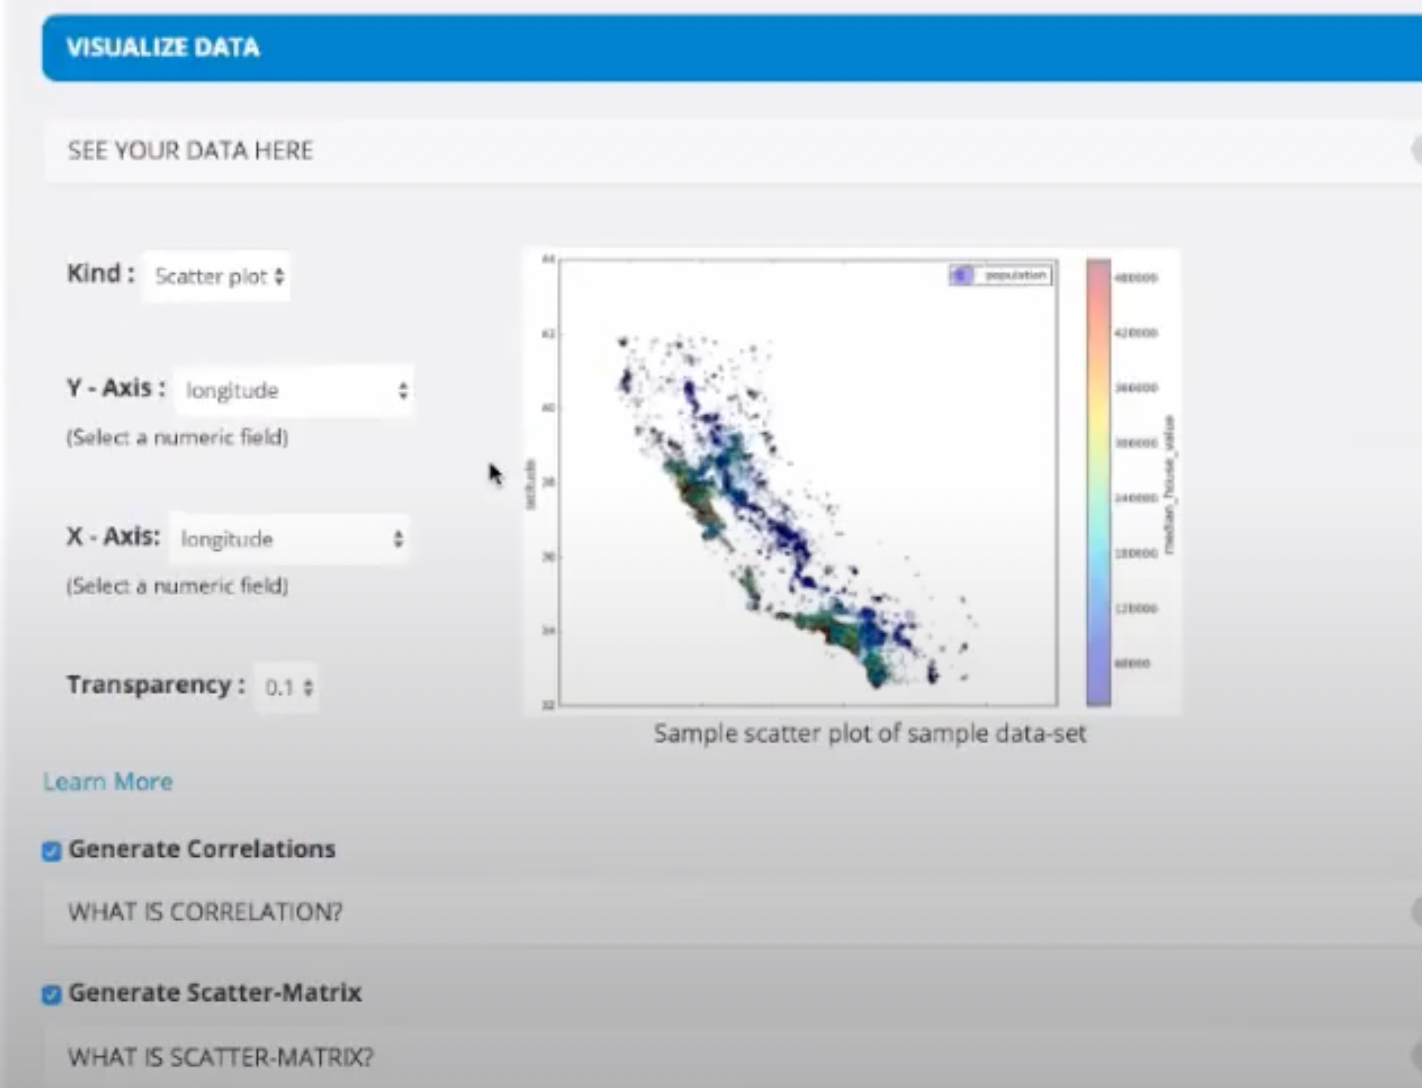
- It will create a scattered graph out of the data given for us to visualise. We turn on Generate Corelations and Generate Scatter-Matrix.
- In the Categorial Field Selection, we can fix the missing values. We also divide our data in Numerical Fields and Categorial Fields. For example: Longitude is a numerical field whereas ocean proximity is a catrgorial field.
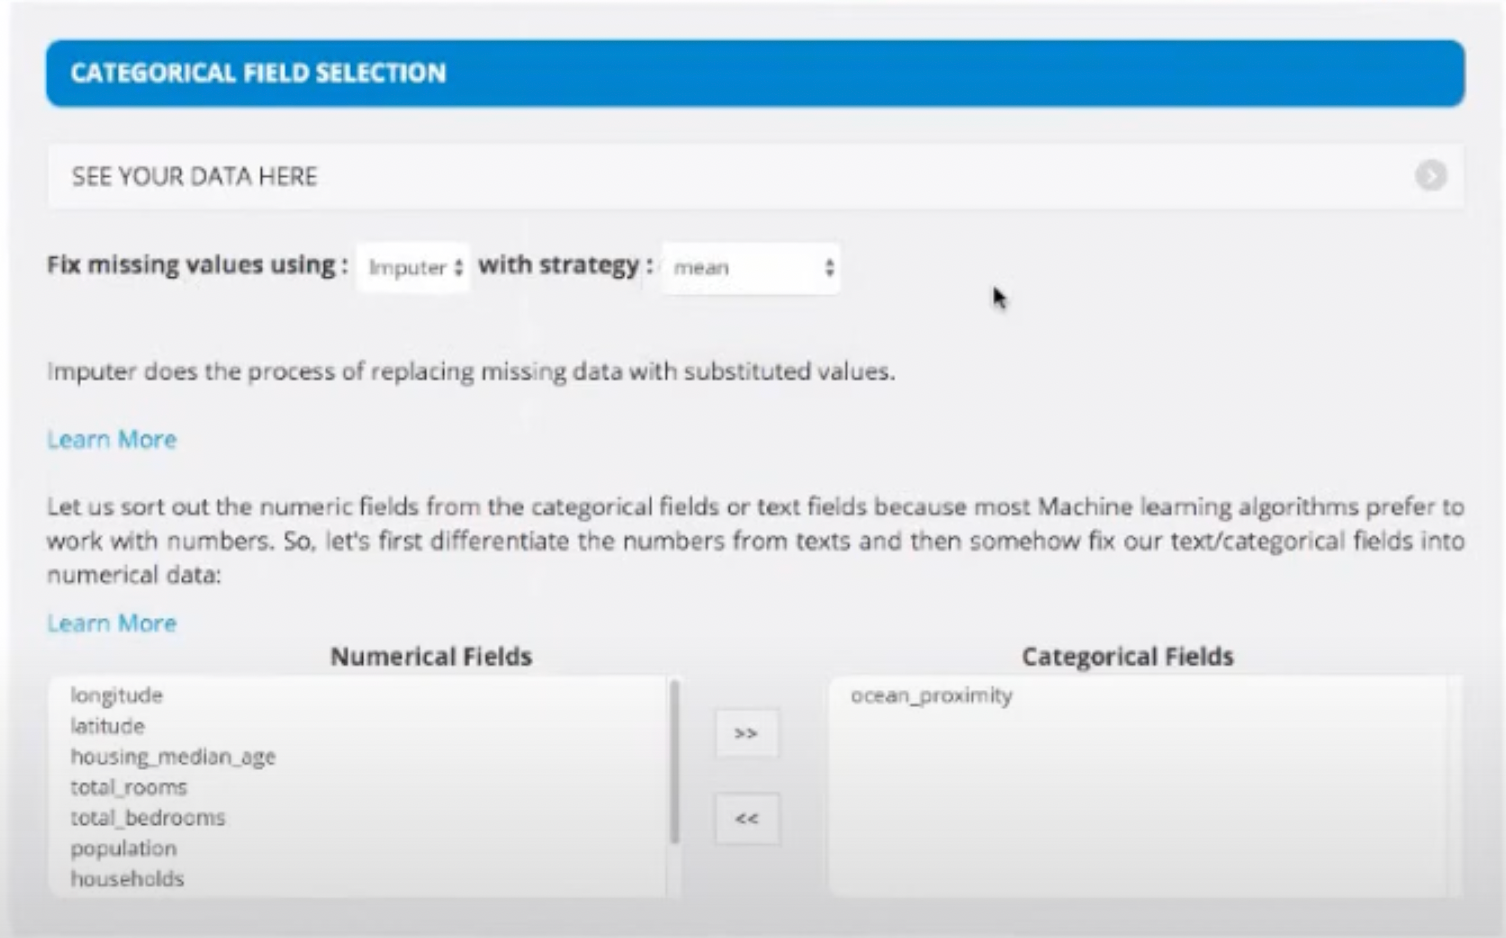
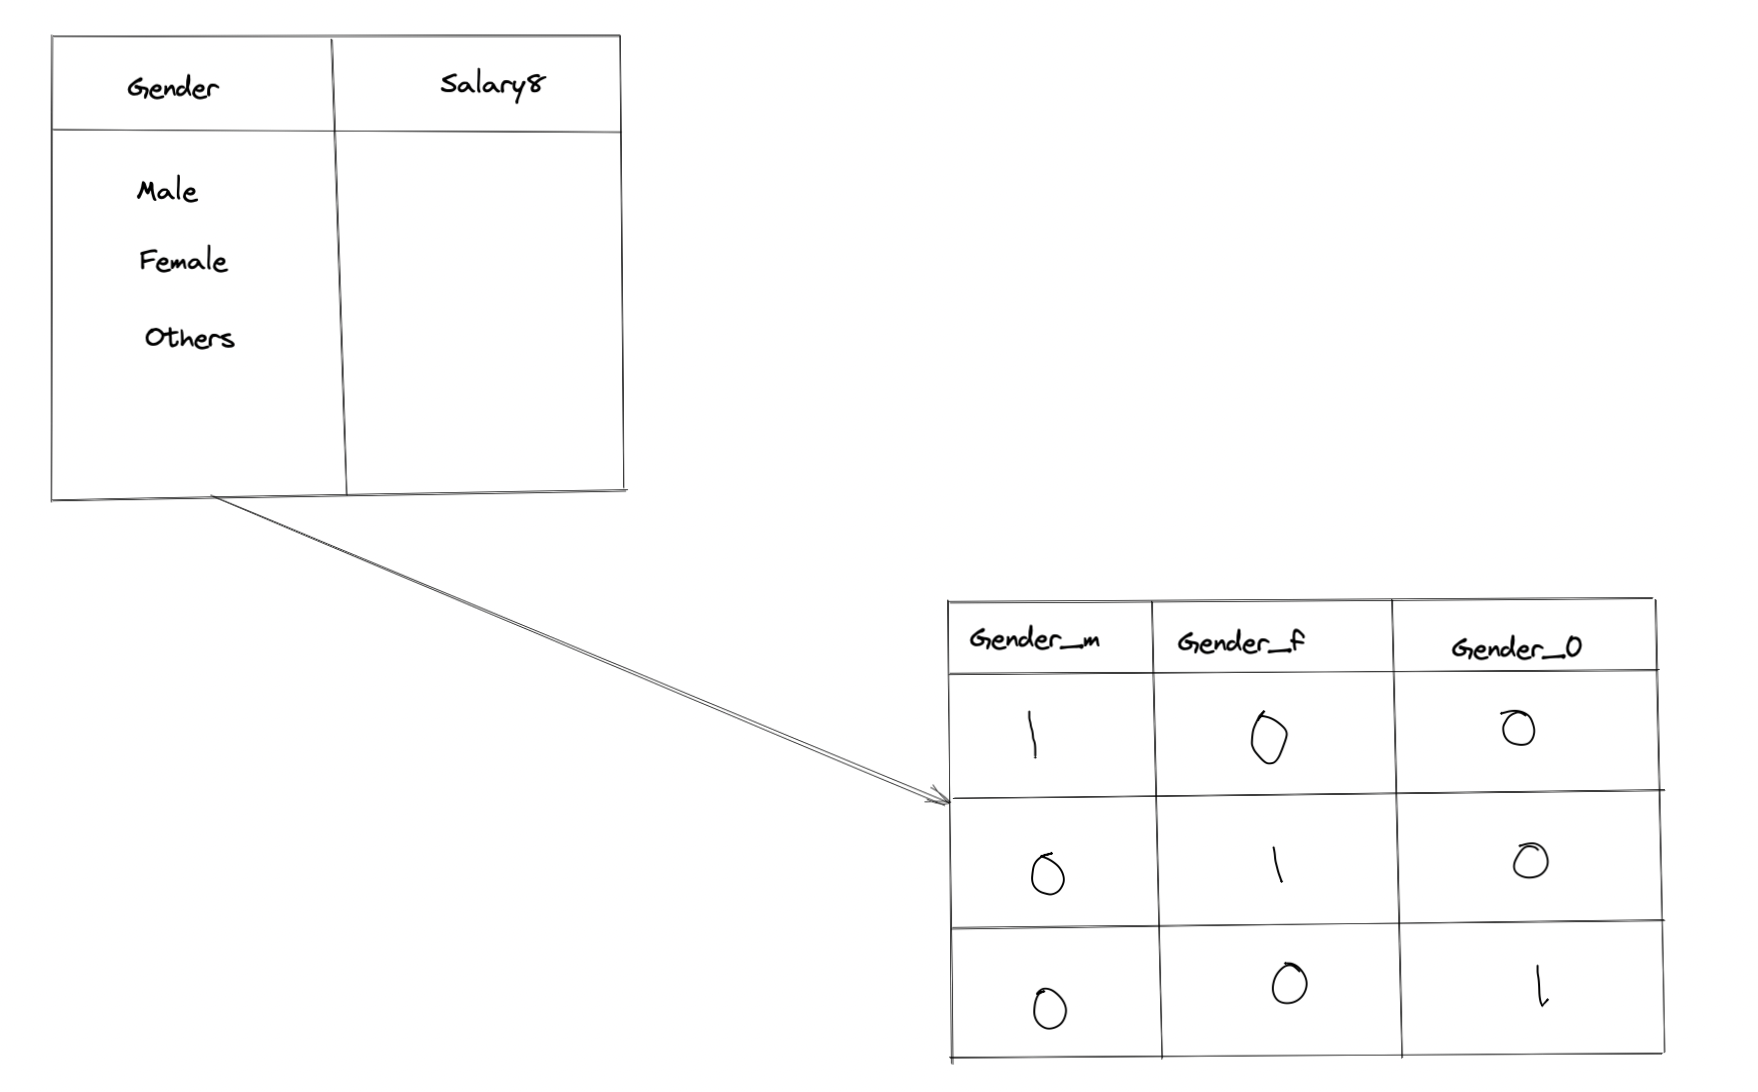
What is categorial field selection?
It is the process of converting a generic dataset into numerical format and tabular format to feed the algorithm.
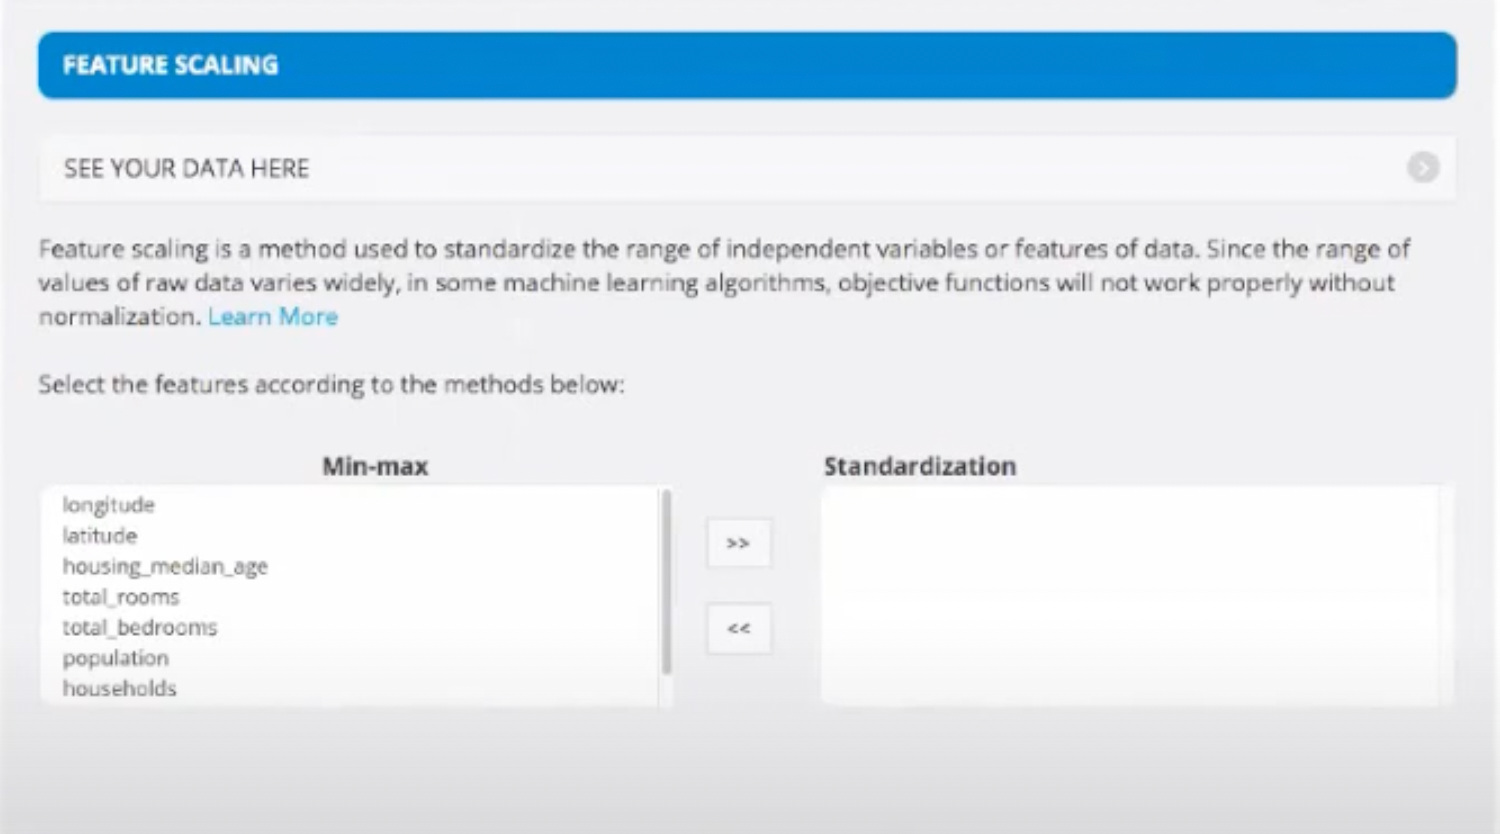
- Then we scale our data under Feature Scaling so that the data we feed is between 0 and 1. This is done as most of the algorithms work more efficiently when the data is scaled.
- Now, we select our algorithm. For this project we select 3 algorithms, namely - Linear Regression, Random Forest, Decision Tree, etc. but there are 100s of other algorithms available to use.
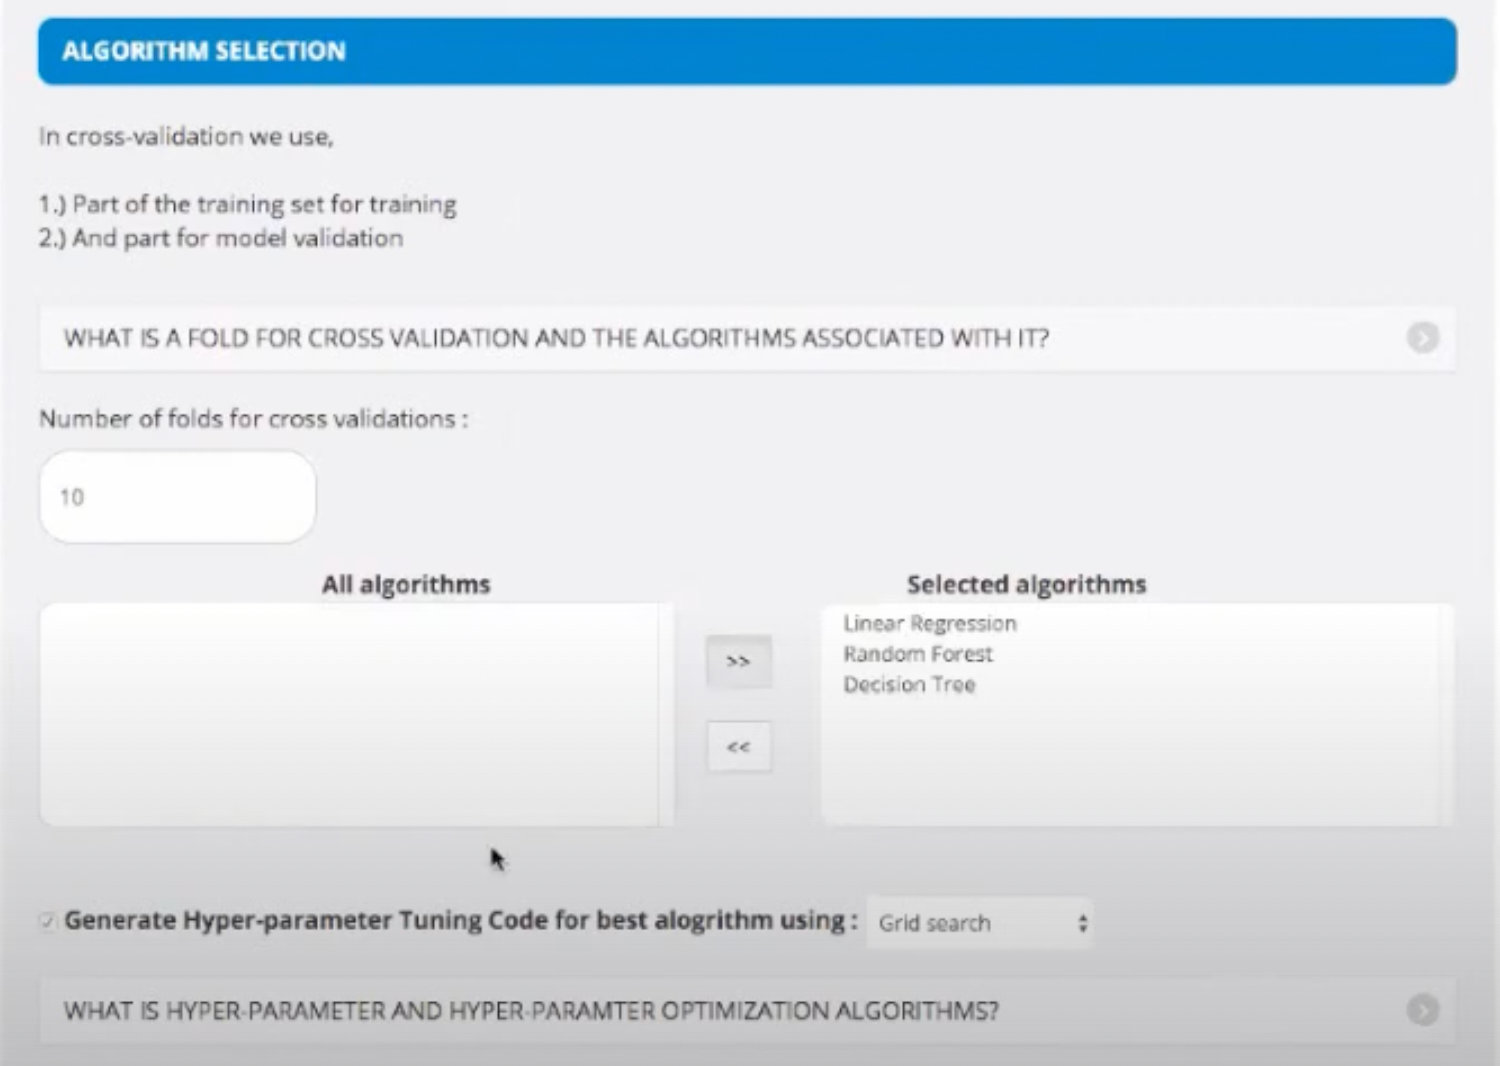
How do we select the best algorithm?
Start with simplest algorithms such as Linear Regression. Depending upon the output, you'd want to solve specific problems. That will be the time to research about more specific algorithms that solve those problems. You will learn about them once you encounter the challenges. No need to understand different algorithms at this stage.
- We then create a Jupyter Notebook where the the software develops the code for us. It also creates a really concise documentation which you can go through to understand what each part of code is doing.
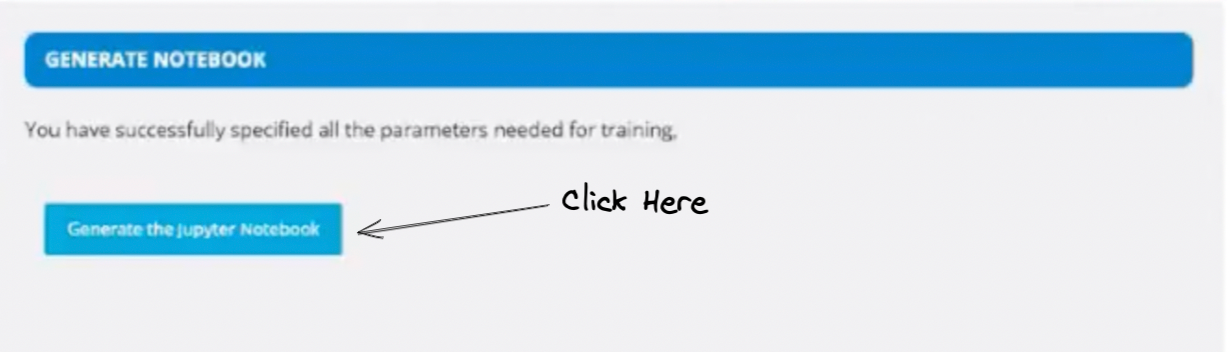
What is a notebook?
Jypyter Notebook is sort of combination of documentation with script that can be executed on demand. It is an open-source project which makes it easier to conduct ML experiments collaboratively.
What is feature scaling?
Let's say there is a column with values varying between 100 and 10000. Most algorithms don't work really well with such varying values. So we scale the minimum value to 0 and the maximum value to 1. The rest values are scaled in between accordingly. Now, since the vlaues have reduced a lot, the algorithms work really well.
What to do next?
- Dive deep into the algorithms
- Find where the model can prove to be useful
- You can follow good books. Some good recommendations are Hands-On Machine Learning with Scikit-Learn, Keras, and TensorFlow and Deep Learning by Yoshua Bengio.
- There is useful learning content on YouTube as well, check that out!
A message by the speaker
I really enjoyed being a part of Git Commit Show and look forward to more such interactions. This event has great potential and I want to see it as one of the largest events across the globe.
For more such talks, attend Git Commit Show live. The next season is coming soon!

![OS for Devs - Ubuntu vs nixOS vs macOS [Developers Roundtable]](/content/images/size/w750/2023/12/IMG_20231216_204048_584.jpg)


Member discussion